Refine
Estimated Years 2000-2009Clear
6,589 results foundRefine Search
94 Brake Lining NUMERICAL REFERENCE LIST Drum FMS No, Diam.
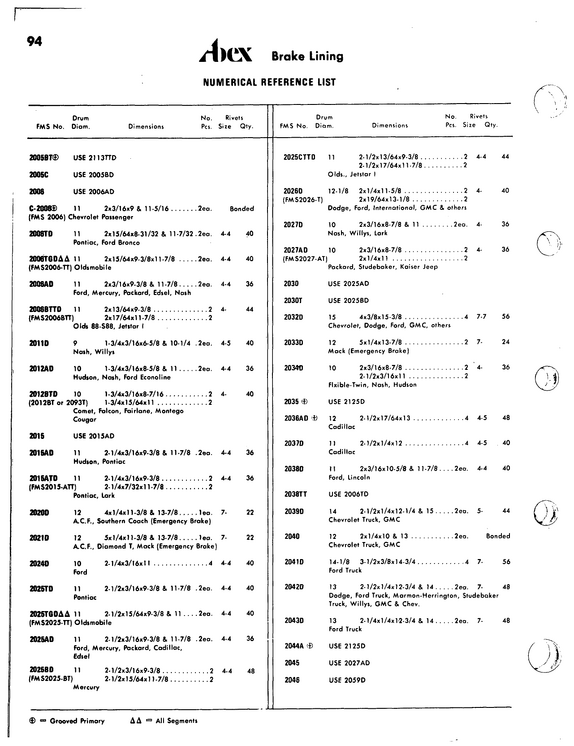
refid# g25G4GnaKN3eobkVbB2ZQVm2e1 page
THE BEN01X CORPORATION . ...FRicnori materials division TROY, NEW YORK CLEVELAND, TENN.
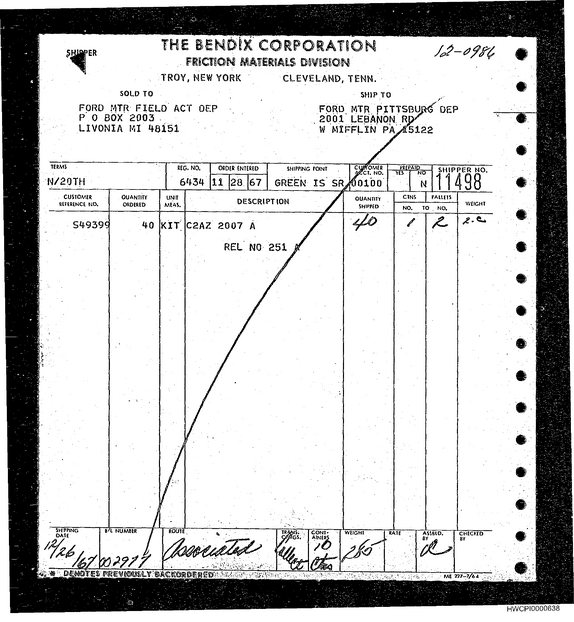
refid# 7O7x7j6KLNKBeJ4L9p7MO3gQa1 page
HELMSexpress COMPANY RECEIVED, subject tothe classification* and tariffsin effect on the date of the receipt by the carrier of tho proporty described In the Original Bill of Lading, At Green Island, N.
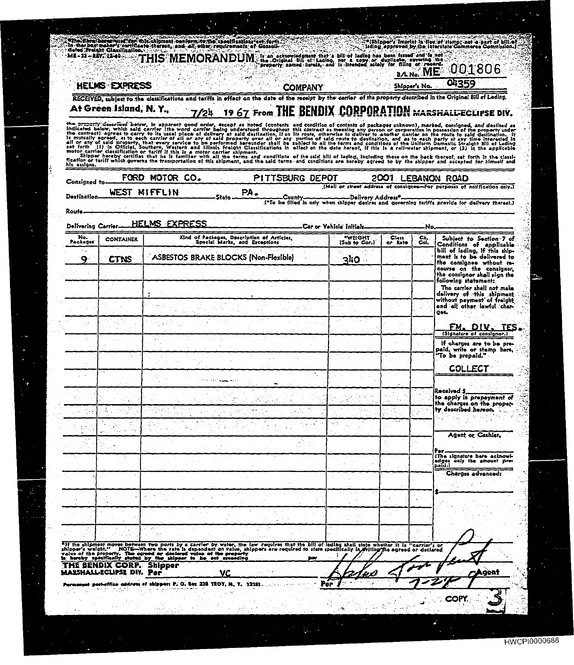
refid# gaNyrgOZMB5kO7Z7pgRLNv2Rq1 page
Ml THE BENDIX CORPORATION FRICTION MATERIALS DIVISION TROY, NEW YORK SOLD FOUO.Mft FIELD tfCT i'1-F* P 0 LVOX 2004 TO uvo?
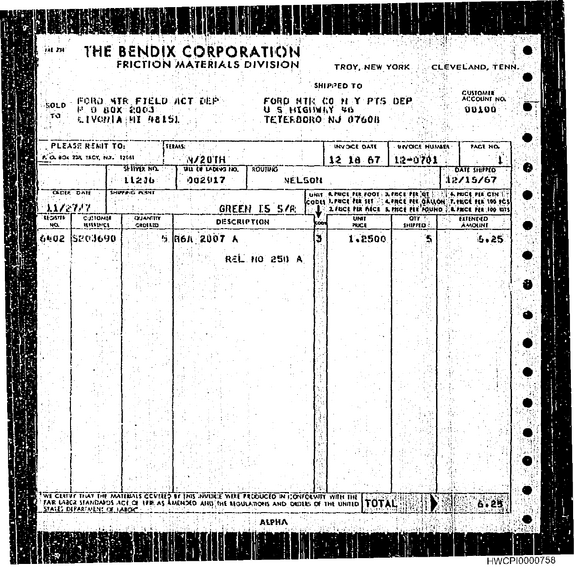
refid# 8V92pZk6zo7G2mz0vk0zm2kee1 page
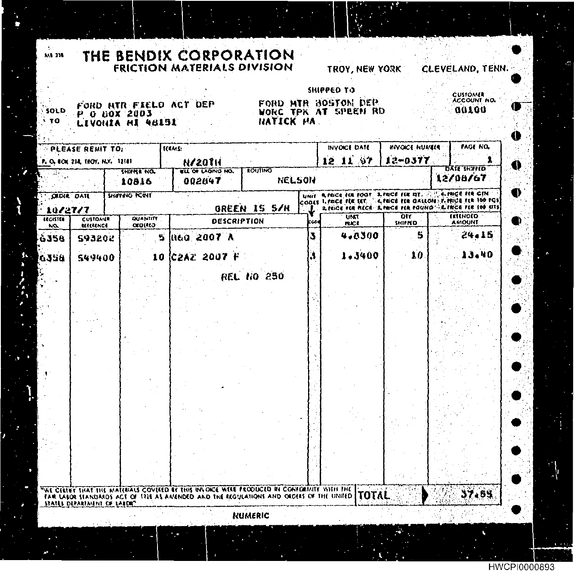
mi m THE BENDIX CORPORATION FRICTION MATERIALS DIVISION TROY, NEW YORK SOLD ' T fOHO MTR FIELD ACT DEP f* Q UOX 2003 UIVOMIA Ml *5131 SHIPPED TO FORD MTR 30ST0M PER WORC TPK AT SiPEEM RO NATICK MA CLEVELAND, TENN. custom** ACCOUNT NQ. 00100 : PLEASE REMIT TOj TCIMS: INVCHCI DAtf tffVCfCI NUVM >. 0. icx iu, t*oy. n,V. uni $wm ho, 10516 fl/20tn a o* lA&vo no. 0025*17 IOUT1NO i2 n *'t NELSON 12-0377 12/05/67 OAU !
refid# J3V83VwXzva7V9xDop87bQgz21 page
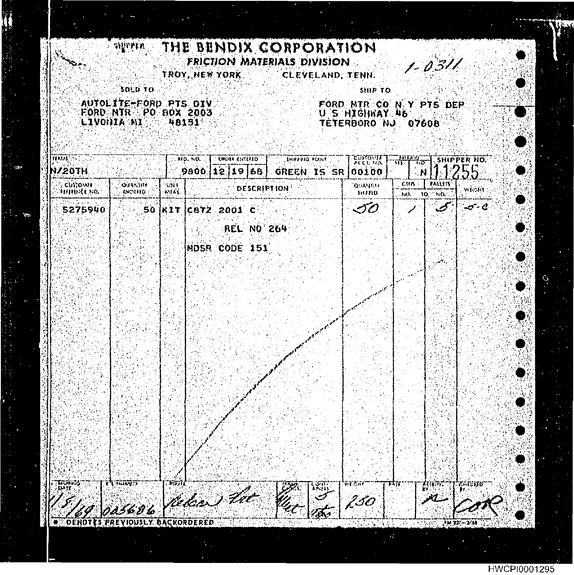
AUTOLlTE-FORP PTS OJV HORD HTR ^0 BOX 2003 LiVoi^lA -MX 48151" -.a j/gorM, ^vifju`< i >-o.
refid# opd5bnJdJ1xMoXoX6O1KJrqX1 page
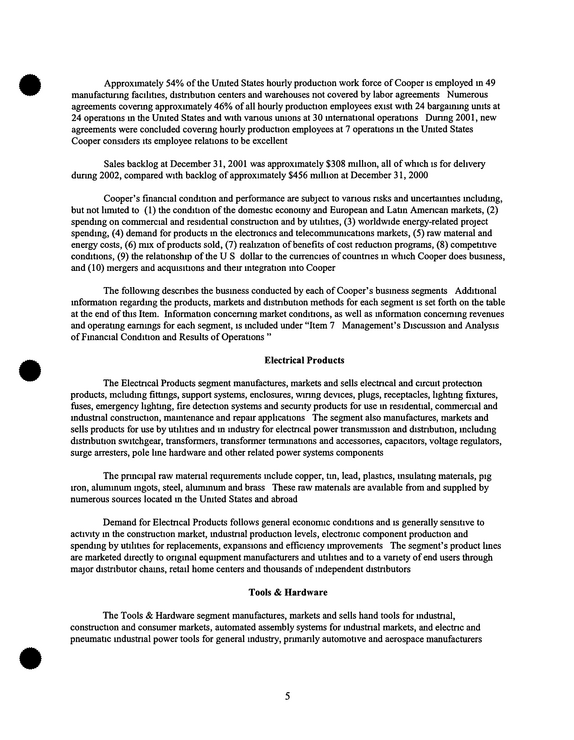
Approximately 54% of the United States hourly production work force of Cooper is employed in 49 manufacturing facilities, distribution centers and warehouses not covered by labor agreements Numerous agreements covermg approximately 46% of all hourly production employees exist with 24 bargaining units at 24 operations m the Umted States and with various unions at 30 mtemational operations During 2001, new agreements were concluded covermg hourly production employees at 7 operations in the United States Cooper considers its employee relations to be excellent Sales backlog at December 31, 2001 was approximately $308 million, all of which is for delivery during 2002, compared with backlog of approximately $456 million at December 31, 2000 Cooper's financial condition and performance are subject to various risks and uncertainties mcludmg, but not limited to (1) the condition of the domestic economy and European and Latin American markets, (2) spending on commercial and residential construction and by utilities, (3) worldwide energy-related project spending, (4) demand for products m the electronics and telecommunications markets, (5) raw material and energy costs, (6) mix of products sold, (7) realization of benefits of cost reduction programs, (8) competitive conditions, (9) the relationship of the U S dollar to the currencies of countries in which Cooper does business, and (10) mergers and acquisitions and their integration mto Cooper The following describes the business conducted by each of Cooper's business segments Additional information regarding the products, markets and distribution methods for each segment is set forth on the table at the end of this Item.
refid# nNbGDJa49y5v1e0Z48207jp281 page
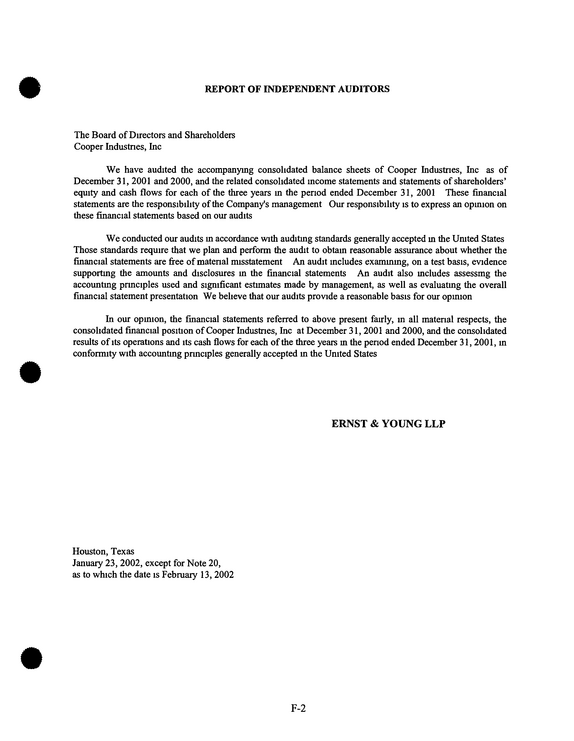
REPORT OF INDEPENDENT AUDITORS The Board of Directors and Shareholders Cooper Industries, Inc We have audited the accompanying consolidated balance sheets of Cooper Industries, Inc as of December 31, 2001 and 2000, and the related consolidated income statements and statements of shareholders' equity and cash flows for each of the three years m the period ended December 31, 2001 These financial statements are the responsibility of the Company's management Our responsibility is to express an opmion on these financial statements based on our audits We conducted our audits m accordance with auditing standards generally accepted m the United States Those standards require that we plan and perform the audit to obtain reasonable assurance about whether the financial statements are free of material misstatement An audit includes examining, on a test basis, evidence supporting the amounts and disclosures m the financial statements An audit also mcludes assessmg the accounting principles used and significant estimates made by management, as well as evaluatmg the overall financial statement presentation We believe that our audits provide a reasonable basis for our opmion In our opmion, the financial statements referred to above present fairly, m all material respects, the consolidated financial position of Cooper Industries, Inc at December 31, 2001 and 2000, and the consolidated results of its operations and its cash flows for each of the three years m the period ended December 31, 2001, in conformity with accounting principles generally accepted m the United States ERNST & YOUNG LLP Houston, Texas January 23, 2002, except for Note 20, as to which the date is February 13, 2002 F-2
refid# VJ6ZaY1MyG0kYb9Zdvq2Je5281 page
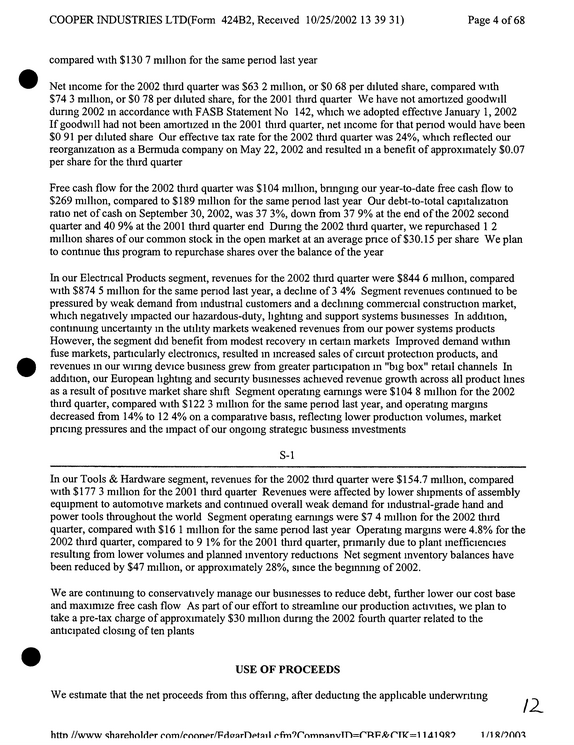
COOPER INDUSTRIES LTD(Form 424B2, Received 10/25/2002 13 39 31) Page 4 of 68 compared with $130 7 million for the same period last year Net income for the 2002 third quarter was $63 2 million, or $0 68 per diluted share, compared with $74 3 million, or $0 78 per diluted share, for the 2001 third quarter We have not amortized goodwill during 2002 in accordance with FASB Statement No 142, which we adopted effective January 1,2002 If goodwill had not been amortized in the 2001 third quarter, net income for that period would have been $0 91 per diluted share Our effective tax rate for the 2002 third quarter was 24%, which reflected our reorganization as a Bermuda company on May 22, 2002 and resulted in a benefit of approximately $0.07 per share for the third quarter Free cash flow for the 2002 third quarter was $104 million, bringing our year-to-date free cash flow to $269 million, compared to $189 million for the same period last year Our debt-to-total capitalization ratio net of cash on September 30, 2002, was 37 3%, down from 37 9% at the end of the 2002 second quarter and 40 9% at the 2001 third quarter end During the 2002 third quarter, we repurchased 1 2 million shares of our common stock in the open market at an average price of $30.15 per share We plan to continue this program to repurchase shares over the balance of the year In our Electrical Products segment, revenues for the 2002 third quarter were $844 6 million, compared with $874 5 million for the same period last year, a decline of 3 4% Segment revenues continued to be pressured by weak demand from industrial customers and a declining commercial construction market, which negatively impacted our hazardous-duty, lighting and support systems businesses In addition, continuing uncertainty m the utility markets weakened revenues from our power systems products However, the segment did benefit from modest recovery m certain markets Improved demand within fuse markets, particularly electronics, resulted m increased sales of circuit protection products, and revenues in our wiring device business grew from greater participation m "big box" retail channels In addition, our European lighting and security businesses achieved revenue growth across all product lines as a result of positive market share shift Segment operating earnings were $104 8 million for the 2002 third quarter, compared with $122 3 million for the same period last year, and operating margins decreased from 14% to 12 4% on a comparative basis, reflecting lower production volumes, market pricing pressures and the impact of our ongoing strategic business investments S-l In our Tools & Hardware segment, revenues for the 2002 third quarter were $154.7 million, compared with $177 3 million for the 2001 third quarter Revenues were affected by lower shipments of assembly equipment to automotive markets and continued overall weak demand for mdustnal-grade hand and power tools throughout the world Segment operating earnings were $7 4 million for the 2002 third quarter, compared with $16 1 million for the same period last year Operating margins were 4.8% for the 2002 third quarter, compared to 9 1% for the 2001 third quarter, primarily due to plant inefficiencies resulting from lower volumes and planned inventory reductions Net segment inventory balances have been reduced by $47 million, or approximately 28%, since the beginning of 2002.
refid# 4J2Nd9QwpnG9B6pGqp76RJ8qV1 page
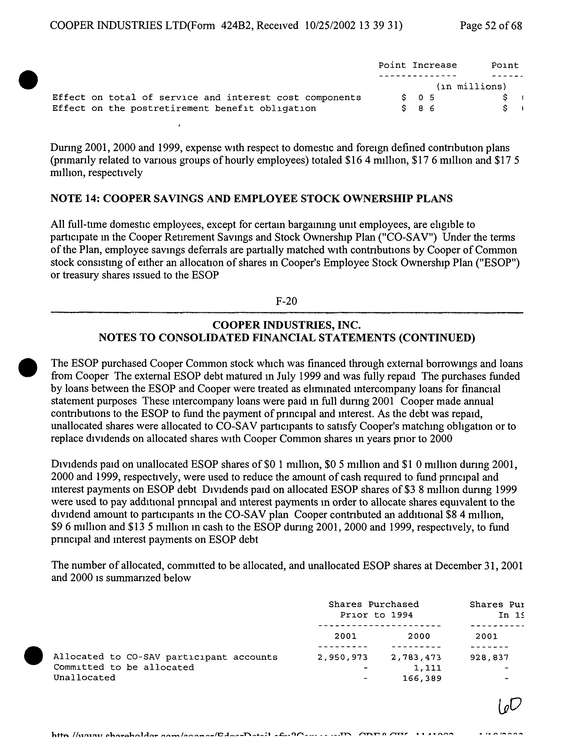
COOPER INDUSTRIES LTD(Form 424B2, Received 10/25/2002 13 39 31) Page 52 of 68 Effect on total of service and interest cost components Effect on the postretirement benefit obligation Point Increase Point (in millions) $05 $ $86 $ During 2001, 2000 and 1999, expense with respect to domestic and foreign defined contribution plans (primarily related to various groups of hourly employees) totaled $16 4 million, $17 6 million and $17 5 million, respectively NOTE 14: COOPER SAVINGS AND EMPLOYEE STOCK OWNERSHIP PLANS All full-time domestic employees, except for certain bargainmg unit employees, are eligible to participate m the Cooper Retirement Savings and Stock Ownership Plan ("CO-SAV") Under the terms of the Plan, employee savings deferrals are partially matched with contributions by Cooper of Common stock consistmg of either an allocation of shares in Cooper's Employee Stock Ownership Plan ("ESOP") or treasury shares issued to the ESOP F-20 COOPER INDUSTRIES, INC.
refid# 9J04vgB0nNe43rG7K0RQRjJMq1 page
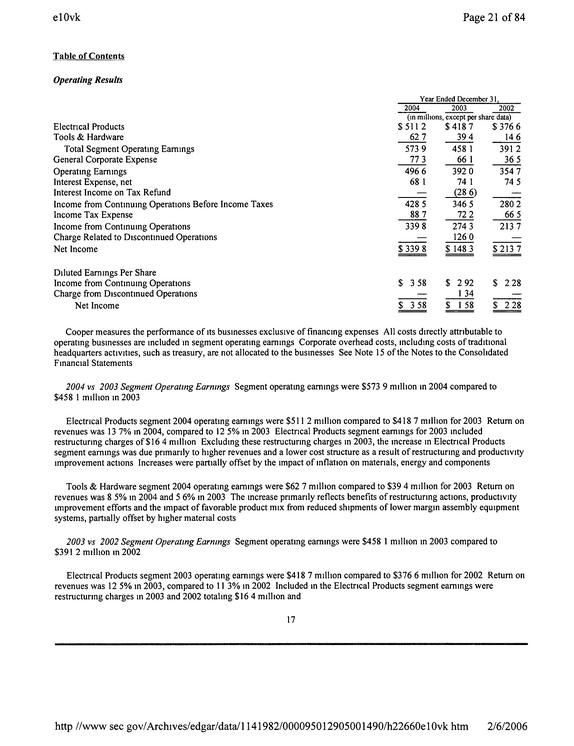
elOvk Page 21 of 84 Table of Contents Operating Results Electrical Products Tools & Hardware Total Segment Operating Earnings General Corporate Expense Operating Earnings Interest Expense, net Interest Income on Tax Refund Income from Continuing Operations Before Income Taxes Income Tax Expense Income from Continuing Operations Charge Related to Discontinued Operations Net Income Diluted Earnings Per Share Income from Continuing Operations Charge from Discontinued Operations Net Income _______Year Ended December 31, 2004 2003 2002 (in millions, except per share data) $511 2 $4187 $ 376 6 62 7 39 4 14 6 573 9 77 3 458 1 66 1 391 2 36 5 496 6 68 1 -- 392 0 74 1 (28 6) 354 7 74 5 -- 428 5 88 7 346 5 72 2 280 2 66 5 339 8 -- 274 3 126 0 213 7 -- $ 339 8 $ 148 3 $213 7 $ 3 58 -- $ 3 58 $ 2 92 1 34 $ 1 58 $ 2 28 -- $ 2 28 Cooper measures the performance of its businesses exclusive of financing expenses All costs directly attributable to operating businesses are included in segment operating earnings Corporate overhead costs, including costs of traditional headquarters activities, such as treasury, are not allocated to the businesses See Note 15 of the Notes to the Consolidated Financial Statements 2004 vs 2003 Segment Operating Earnings Segment operating earnings were $573 9 million in 2004 compared to $458 1 million in 2003 Electrical Products segment 2004 operating earnings were $5112 million compared to $418 7 million for 2003 Return on revenues was 13 7% in 2004, compared to 12 5% in 2003 Electrical Products segment earnings for 2003 included restructuring charges of $16 4 million Excluding these restructuring charges in 2003, the increase in Electrical Products segment earnings was due primarily to higher revenues and a lower cost structure as a result of restructuring and productivity improvement actions Increases were partially offset by the impact of inflation on materials, energy and components Tools & Hardware segment 2004 operating earnings were $62 7 million compared to $39 4 million for 2003 Return on revenues was 8 5% in 2004 and 5 6% in 2003 The increase primarily reflects benefits of restructuring actions, productivity improvement efforts and the impact of favorable product mix from reduced shipments of lower margin assembly equipment systems, partially offset by higher material costs 2003 vs 2002 Segment Operating Earnings Segment operating earnings were $458 1 million in 2003 compared to $391 2 million in 2002 Electrical Products segment 2003 operating earnings were $418 7 million compared to $376 6 million for 2002 Return on revenues was 12 5% in 2003, compared to 11 3% in 2002 Included in the Electrical Products segment earnings were restructuring charges m 2003 and 2002 totaling $16 4 million and 17 http //www sec gov/Archives/edgar/data/1141982/000095012905001490/h22660el0vk htm 2/6/2006
refid# QXyg7KNnq9dXypwM1N9OXDw571 page
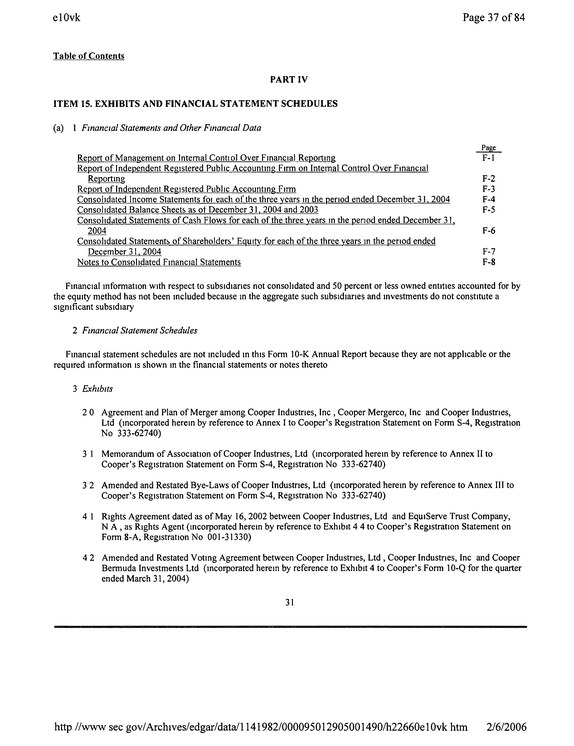
elOvk Page 37 of 84 Table of Contents PART IV ITEM 15.
refid# rejZeMyYL3G8RzpmvrzVnjKXr1 page
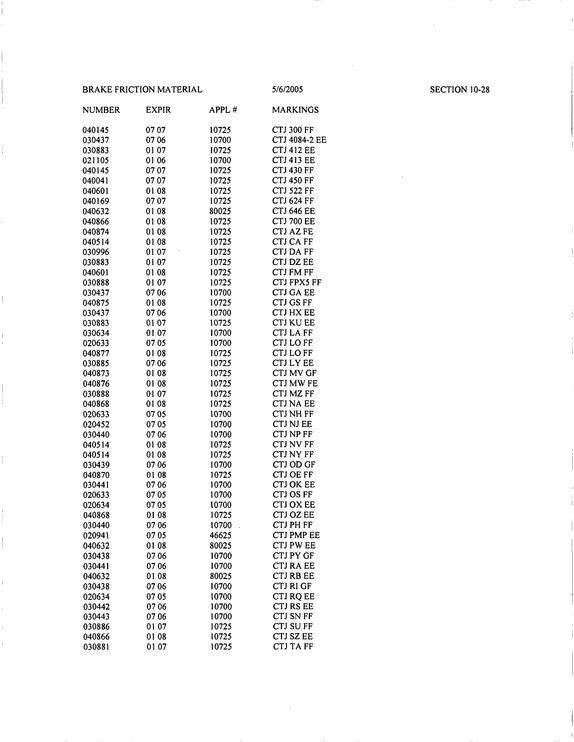
BRAKE FRICTION MATERIAL NUMBER EXPIR APPL # 040145 030437 030883 021105 040145 040041 040601 040169 040632 040866 040874 040514 030996 030883 040601 030888 030437 040875 030437 030883 030634 020633 040877 030885 040873 040876 030888 040868 020633 020452 030440 040514 040514 030439 040870 030441 020633 020634 040868 030440 020941 040632 030438 030441 040632 030438 020634 030442 030443 030886 040866 030881 07 07 07 06 01 07 01 06 07 07 07 07 01 08 07 07 01 08 01 08 01 08 01 08 01 07 01 07 01 08 01 07 07 06 01 08 07 06 01 07 01 07 07 05 01 08 07 06 01 08 01 08 01 07 01 08 07 05 07 05 07 06 01 08 01 08 07 06 01 08 07 06 07 05 07 05 01 08 07 06 07 05 01 08 07 06 07 06 01 08 07 06 07 05 07 06 07 06 01 07 01 08 01 07 10725 10700 10725 10700 10725 10725 10725 10725 80025 10725 10725 10725 10725 10725 10725 10725 10700 10725 10700 10725 10700 10700 10725 10725 10725 10725 10725 10725 10700 10700 10700 10725 10725 10700 10725 10700 10700 10700 10725 10700 46625 80025 10700 10700 80025 10700 10700 10700 10700 10725 10725 10725 . 5/6/2005 MARKINGS CTJ300 FF CTJ 4084-2 EE CTJ412 EE CTJ 413 EE CTJ 430 FF CTJ 450 FF CTJ 522 FF CTJ 624 FF CTJ 646 EE CTJ 700 EE CTJ AZ FE CTJ CA FF CTJ DA FF CTJ DZ EE CTJ FM FF CTJ FPX5 FF CTJ GA EE CTJ GS FF CTJ HX EE CTJ KU EE CTJ LA FF CTJ LO FF CTJ LO FF CTJ LY EE CTJ MV GF CTJ MW FE CTJ MZ FF CTJ NA EE CTJ NH FF CTJ NJ EE CTJ NP FF CTJ NV FF CTJ NY FF CTJ OD GF CTJ OE FF CTJ OK EE CTJ OS FF CTJ OX EE CTJ OZ EE CTJ PH FF CTJ PMP EE CTJ PW EE CTJ PY GF CTJ RA EE CTJ RB EE CTJ RI GF CTJ RQ EE CTJ RS EE CTJ SN FF CTJ SU FF CTJ SZ EE CTJ TA FF SECTION 10-28
refid# x5QvKxL6124eGyKKoDo9mo3Mg1 page
{ Atm. occvp.
refid# v1xGa31865d5v941N9LdrxQw64 pages
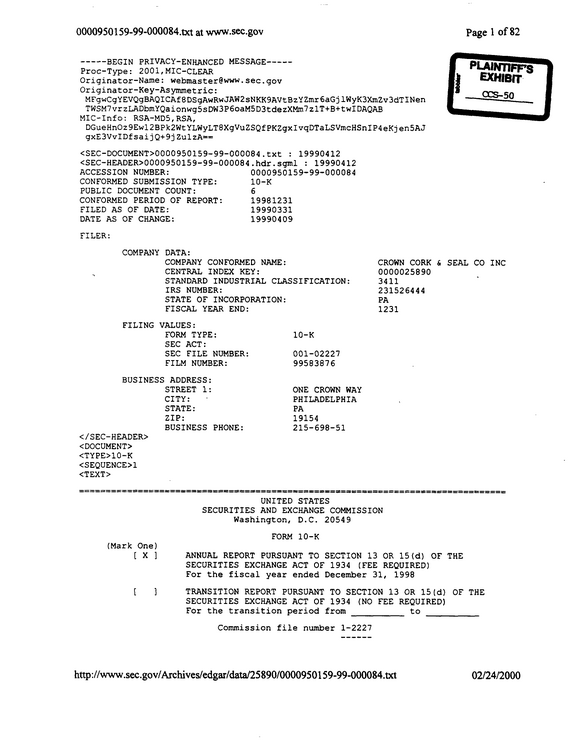
0000950159-99-000084.txt at www.sec.gov --------- BEGIN PRIVACY-ENHANCED MESSAGE---------Proc-Type: 2001,MIC-CLEAR Originator-Name: webmasterwww.sec.gov Originator-Key-Asymmetric: MFgwCgYEVQgBAQICAf8DSgAwRwJAW2sNKK9AVtBzYZmr6aGjlWyK3XmZv3dTINen TWSM7vrzLADbmYQaionwg5sDW3P6oaM5D3tdezXMm7zlT+B+twIDAQAB MIC-Info: RSA-MD5,RSA, DGueHnOz9Ewl2BPk2WtYLWyLT8XgVuZSQfPKZgxIvqDTaLSVmcHSnIP4eKjen5AJ gxE3VvIDfsaijQ+9j ZulzA== <SEC-DOCUMENT>0000950159-99-000084.txt : 19990412 <SEC-HEADER>0000950159-99-000084.hdr.sgml : 19990412 ACCESSION NUMBER: 0000950159-99-000084 CONFORMED SUBMISSION TYPE: 10-K PUBLIC DOCUMENT COUNT: 6 CONFORMED PERIOD OF REPORT: 19981231 FILED AS OF DATE: 19990331 DATE AS OF CHANGE: 19990409 FILER: COMPANY DATA: COMPANY CONFORMED NAME: CENTRAL INDEX KEY: STANDARD INDUSTRIAL CLASSIFICATION: IRS NUMBER: STATE OF INCORPORATION: FISCAL YEAR END: CROWN CORK & SEAL CO INC 0000025890 3411 231526444 PA 1231 FILING VALUES: FORM TYPE: SEC ACT: SEC FILE NUMBER: FILM NUMBER: 10-K 001-02227 99583876 BUSINESS ADDRESS: STREET 1: CITY: STATE: ZIP: BUSINESS PHONE: </SEC-HADER> <DOCUMENT> <TYPE>10-K <SEQUENCE>1 <TEXT> ONE CROWN WAY PHILADELPHIA PA 19154 215-698-51 (Mark One) [X1 [] UNITED STATES SECURITIES AND EXCHANGE COMMISSION Washington, D.C. 20549 FORM 10-K ANNUAL REPORT PURSUANT TO SECTION 13 OR 15(d) OF THE SECURITIES EXCHANGE ACT OF 1934 (FEE REQUIRED) For the fiscal year ended December 31, 1998 TRANSITION REPORT PURSUANT TO SECTION 13 OR 15(d) OF THE SECURITIES EXCHANGE ACT OF 1934 (NO FEE REQUIRED) For the transition period from to Commission file number 1-2227 http://www.sec.gov/Archives/edgar/data/25890/0000950159-99-000084.txt 02/24/2000 0000950159-99-000084.txt at vAVw.sec.gov Page 2 of 82 Crown Cork & Seal Company, Inc.
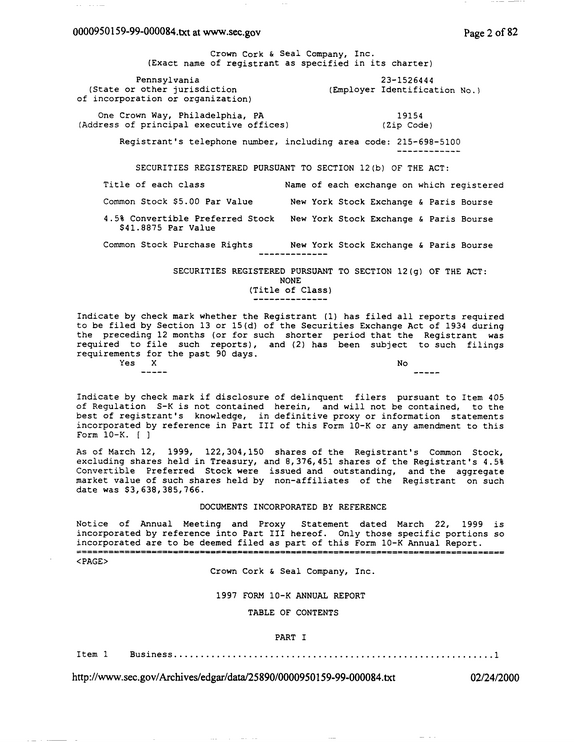
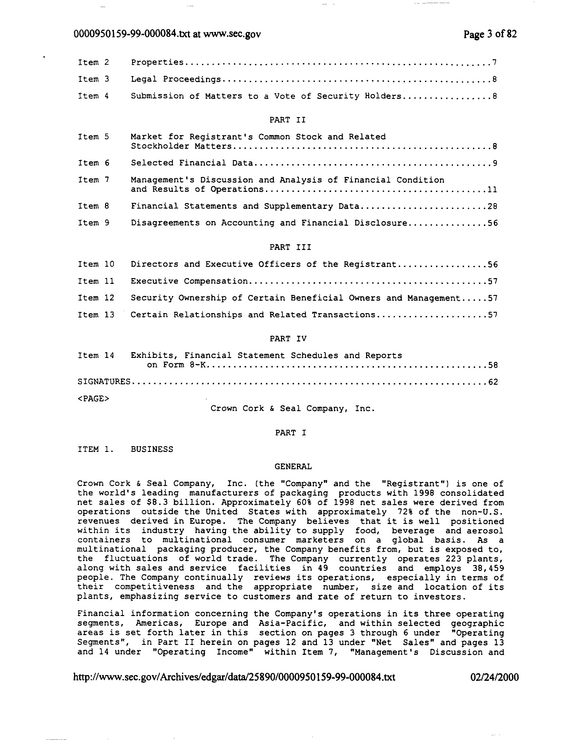
refid# gEQ1K8QndY3jbYLxvMQwN0Yn384 pages